.png)
Macroeconomic Figures for the Fashion Industry: Three big Regions (US-EU-China) Analysis for the Fashion World:
- azrbayraktar
- Jun 17, 2025
- 6 min read

In our previous blog post, Summary Report for Fashion World 2025, we summarized the main challenges and risks facing the fashion industry according to BOF and McKinsey's State of Fashion Report 2025.
This year, expectations about the industry show us modest growth after the pandemic. Brands will fight for their market share harder this year. The growing market of the last year is not to be seen this year in all three markets (The State of Fashion, p. 10-11).
Regarding these three big markets, my previous blog post dealt with the latest Situation of China in Terms of Macro Forces. Now, I would like to focus more on the European and US markets and summarize the data from The State of Fashion Report (2025) with some additional information (The State of Fashion, 2025, pp. 10-11).
The State of Fashion BOF Report always divides the industry into two main categories, non-luxury and luxury markets, and it also focuses on three big markets, the US, EU, and China.
Compared to 2021, 2022, and 202,3, this year the number will be as follows for luxury and non-luxury markets
Retail Sales Growth on a year-to-year basis by geography and segment
Non-Luxury Market:
2021 | 2022 | 2023 | 2024 E H1 | 2024 E H2 | 2025 E | |
Europe | 9% | 13% | 4% | 1% | 1-3% | 2-4% |
US | 24% | 2% | -1% | 2% | 2-3% | 3-4% |
China | 12% | -3% | 9% | 4% | 3-4% | 2-4% |
Source: The State of Fashion, BOF, and McKinsey
To understand these figures and their drivers, it would be nice to look at a deeper index like GDP, inflation, etc., in the following markets.
Non-luxury drivers
In comparison, GDP Growth for the following countries looks as follows, with 5,4% growth of China, following 2% US and 1.4% EU.

GDP comparison gives us a promise about the future growth of the market. As we can see from the figures Chinese market growth will be still higher than EU and USA but as we have discussed in our previous blog about the Situation of China in Terms of Macro Forces, this market should face some problems like decreasing local consumer spending, effects of the real estate crisis, tariff-related pessimism (Song, April 2025), decreasing population etc. Fashion Market Executives, therefore, keep the balance in these 3 big areas and apply customized strategies.
To see the big picture, it is also good to compare these markets according to different variables like average wage, minimum wage, personal saving rates, disposable income, increased tourism, etc., for different markets etc. which all may have an effect on fashion markets as well.
Other macroeconomic values in comparison in the three big Markets

Fashion Analysis for the European Market
General GDP forecasts from the European Central Bank are as follows
2025 | 2026 | 2027 | |
Real GDP Forecast ECC[28] | 0.9% | 1.2% | 1.3% |
If we look in detail at different countries, especially Poland, Spain in the EU, and the UK and Turkey in the regions, we see growth:
UK | France | Germany | Poland | Turkey | Spain | |
GDP Forecast IMF 2025 [29] | 1.6% | 0.8% | 0.3% | 3.5 | 2.6 | 2.3 |
GDP Forecast IMF 2026 * | 1.5% | 1.1% | 1.1% | 3.3 | 3.2 | 1.8 |


Economic Policy Uncertainty Index
As we can see from both tables, in April 2025 Economic Uncertainty Index for the Globe and Europe increased sharply regarding the economic tension between these three markets USA-Europe and China.
The inflation rate in Europe is decreasing.

If we also compare the average wage between Germany and the USA, we can see an increasing trend there
The average labor cost in Europe is as follows

But still there is a new projection for the rising domestic consumption and demand with the decline of the interest rates, a declining unemployment rate of 6.3 in 2025 and 6.2 as a forecast in 2027. However, the pressure on export expectations for competitiveness challenges, trade policies, and tariffs from the US will higher the global tension and put strong weight on the euro zone (ECC, 2025).
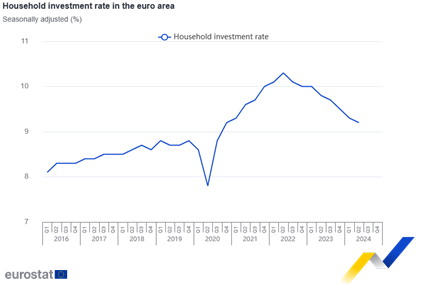
Also, Personal Saving Rate, household saving rates, and investment rates will be another indicator for spending on fashion.


The rise of disposable income in Euro may help to increase the fashion market by 2-4% for non-Luxury and Luxury in Europe especially in Countries like UK and Germany but after the trade war declared by Trump on Wednesday 2.nd April by 20% to all goods from EU will definitely have an huge effect for both sides and fashion supply chain on the whole world will be effected by this decision.
Luxury Market Analysis for Europe:
Retail Sales Growth on a year-to-year basis by geography and segment
2021 | 2022 | 2023 | 2024 E H1 | 2024 E H2 | 2025 E | |
Europe | 15 | 12 | 8 | 1 | 1-2 | 1-3 |
US | 49 | 10 | 5 | 2 | 2-3 | 3-5 |
China | 40 | -6 | 12 | -3 | -10-7 | -3-0 |
Source: The State of Fashion, BOF, and McKinsey
Although the domestic consumption in Europe will stay low because of the cautious behavior of the customers, the tax-free shopping has recovered compared to pandemic levels. Chinese tourists spend more in Japan.
Global Blue company released the monthly report for the tax-free Shopping report (Global Blue, 2025). There can be seen globally a increase for 29% increase globally in Global Tax Free Shopping Sales in-store like-for-like on year performance. Especially for regions like Europe with 19%, Total Asis Pacific with 46%, and total Latin America with 53% shows a positive and promising trend in terms of sales.
For continental Europe origin of the Tax-Free shopper Growth rate compared to the last year 2024 US shoppers had an increase of 34%, GCC (Gulf Cooperation Council: Bahrain, Kuwait, Oman, Qatar, Saudi Arabia, and the United Arab Emirates) countries had an increase of 30% and Mainland China Shoppers tax free spend increased at 1%. (Global Blue, 2025)
Especially Southern Europe was the destination market, with an increase in Spain for 28%, Italy 22%, and France 15%.

Global Blue Monthly Tax Free Update
A Sustained Performance in Continental Europe for International Shopping
These foreign arrivals to Europe will be expected to grow in the future and will have a positive effect on the European Market. According to a recent study by the Austrian Market Research company, especially downtown luxury brands are profiting from increased tourism in European cities. But the middle segment is decreasing.
In 2024, people invested more in spare time activities also services as health care, babysitting, Holidays, etc, home care, courses for Children, medical treatment, etc. But spending on apparel increased only by 4%. The online sales accounted for all sales 12% but the average shipment value was 57 euros; therefore, the share belongs to the Asian Chains Temu and Shein. Also, in retail, the discount chains Woolworths (30 Stores) and Action 352 Stores. The small stores, especially in suburban areas, also had difficulties mentioned in the report, and the future will be the multifunctional usage of the retail area. (Kainrath, May 2025).

Woolworth Store (https://www.woolworth.at/)

Action store (https://www.action.com/de-at/)
As a conclusion, the State of Fashion Reports estimates for Europe an 8% growth from 2024 to 2026 for the Luxury Market in Europe. (The State of Fashion, 2025, p. 11).
References:
BOF, 20 December 2024., ``Fashion Wakes Up to the ‘Silver Generation’ Opportunity`` https://www.businessoffashion.com/articles/retail/the-state-of-fashion-2025-report-silver-generation-consumer-cohort-older-shopper/
Country Comparisons: https://countryeconomy.com/countries/compare/china/usa?sc=XE0H
Country Economy: https://countryeconomy.com/countries/compare/china/usa?sc=XE0H
Europe Household Saving rates: Retrieved April from <https://ec.europa.eu/eurostat/web/products-euro-indicators/w/2-04102024-ap >
ECC 2025: European Central Bank, retrieved April 2 from <https://www.ecb.europa.eu/press/projections/html/ecb.projections202503_ecbstaff~106050a4fa.en.html>.
Hardcastle J. 2017: ``Walmart’s ‘Very Strong Business Case’ for Cutting Emissions’ ‘retrieved from``https://www.environmentenergyleader.com/stories/walmarts-very-strong-business-case-for-cutting-emissions,14768.
Global Blue (2025): Global Blue Monthly Tax Free Shopping Report, retrieved in May from < https://www.businesswire.com/news/home/20250207266485/en/Global-Blue-Releases-the-Monthly-Tax-Free-Shopping-Business-Update-for-January-2025>.
Gross Savings Rates by country: https://www.ceicdata.com/en/indicator/china/gross-savings-rate
Kainrath, V.: ``Mehr erleben weniger kaufen``, retrieved 14 May 2025 from < https://www.derstandard.at/story/3000000269576/mehr-erleben-weniger-kaufen-oesterreichs-einzelhandel-kommt-nicht-vom-fleck>.
Puma, Refibre: Retrieved 15 May 2025, from <https://about.puma.com/en/circularity/refibre#:~:text=The%20RE%3AFIBRE%20process%20focuses,processing%20to%20create%20new%20textiles.>
Reselfridges: retrieved, 15 May 2025, from <https://www.selfridges.com/GB/en/cat/reselfridges/
Roll, M., Jary 2025. ``Uniqlo: The Strategy Behind The Global Japanese Fast Fashion Retail Brand``, retrieved 15 May 2025 from < https://martinroll.com/resources/articles/strategy/uniqlo-the-strategy-behind-the-global-japanese-fast-fashion-retail-brand/>
The State of Fashion: Business of Fashion (BoF and McKinsey) https://www.businessoffashion.com/reports/news-analysis/the-state-of-fashion-2025-bof-mckinsey-report/
https://www.businessoffashion.com/reports/news-analysis/the-state-of-fashion-2025-bof-mckinsey-report/, or https://www.businessoffashion.com/user/document-viewer/?payload=eyJjdGFMaW5rIjoiaHR0cHM6Ly9jZC5idXNpbmVzc29mZmFzaGlvbi5jb20vcmVwb3J0cy9UaGVfU3RhdGVfb2ZfRmFzaGlvbl8yMDI1LnBkZiIsImFydGljbGVJZCI6Ikw1UURLVEVMNlZHVURNQ1RPUUdHSkxRUllZIiwiYXJ0aWNsZVVybCI6Ii9yZXBvcnRzL25ld3MtYW5hbHlzaXMvdGhlLXN0YXRlLW9mLWZhc2hpb24tMjAyNS1ib2YtbWNraW5zZXktcmVwb3J0LyIsInNpZ25lZCI6ZmFsc2UsInVzZXJJZCI6IjEyNjg2MjU4MTQ3NzQifQ=
Shalal A.: April 22, 2025: https://www.reuters.com/business/imf-cuts-growth-forecasts-most-countries-wake-century-high-us-tariffs-2025-04-22/#:~:text=The%20IMF%20downgraded%20its%20forecast,policy%20uncertainty%20and%20trade%20tensions.
Shalal A.: April 22, 2025: https://www.reuters.com/business/imf-cuts-growth-forecasts-most-countries-wake-century-high-us-tariffs-2025-04-22/#:~:text=The%20IMF%20downgraded%20its%20forecast,policy%20uncertainty%20and%20trade%20tensions.
Song, Lynn, 19 May 2025: ``China April slowdown shows the impact of economic uncertainty``, retrieved May 2025 from <https://think.ing.com/articles/china-april-data-slowdown-showed-impact-from-uncertainty/>
Uncertainty index: https://www.ceicdata.com/en/indicator/china/trade-policy-uncertainty-index
Woolworths: https://www.woolworth.at/
[22] https://ec.europa.eu/eurostat/statistics-explained/index.php?title=Wages_and_labour_costs#:~:text=Highlights.%20In%202024%2C%20the%20average%20hourly%20labour,%E2%82%AC4.1%20in%20Bulgaria%20to%20%E2%82%AC29.8%20in%20Denmark.
[23] https://www.sofi.com/learn/content/average-salary-in-us/#:~:text=This%20content%20may%20include%20information,from%20the%20Social%20Security%20Administration.
[27] https://www.euronews.com/business/2025/05/06/average-salaries-across-europe-which-countries-have-the-highest-pay
[28]https://www.ecb.europa.eu/press/projections/html/ecb.projections202503_ecbstaff~106050a4fa.en.html


Comments