.png)
The General Macro Forces -Market Analyses for the US and the Fashion Industry
- azrbayraktar
- Jul 23, 2025
- 20 min read
Updated: Aug 5, 2025

The fashion market is one of the biggest industries that will be influenced by global forces and uncertainties tremendously. Therefore, analyzing different target markets such as China, the US, the EU, and the interactions between these countries can shed light on the future of fashion markets and the global trade in general.
In previous blog posts, I made a small analysis of China and the EU in terms of fashion market growth. This blog article will deal with the US fashion industry and small indicators that will influence the fashion industry's growth and analysis in general.
For the start, the first indicator will be the GDP Forecasts from the IMF for the 3 big markets as follows:
Table 1: GDP Comparison between Europe, the USA, and China

Figure 1: GDP Comparison between Europe, the USA, and China
(Blue: USA, Red: EU, Gray: China)
The State of Fashion report also summarized the market growth rate for non-luxury and luxury markets for China, Europe, and the USA as follows:
Retail Sales on a year-to-year basis by geography and segment
Table 2: Non-Luxury Market Forecast for Europe, US, China:

Source: The State of Fashion, BOF, and McKinsey
Table 3: Luxury Market Forecast for Europe, US, China:
Luxury Market:

Source: The State of Fashion, BOF, and McKinsey
Another indicator will be the growth of wages in the USA compared to inflation. Right now, it is bigger than inflation. Although the GDP increase, 1.8, was slightly smaller than expected, 2.2, the FED still tries to keep the rates low to boost consumption.

Figure 2: Difference between the inflation rate and growth of wages in the United States from March 2020 to March 2025
Personal savings are low, and consumer purchasing power is increasing.
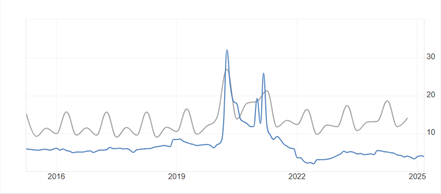
Figure 3: United States vs European Union Personal Savings Rates Comparison
(Blue USA, Gray EU)
In the following chart from FRED, we can also see the increase in the Disposable Personal Income of the USA.

Also, other factors like minimum wage, Inflation rate, disposable income, share of ultra-high net worth individuals, etc., will have an impact on luxury consumption (The State of Fashion, 2025, p. 11).

Figure 5: United States Disposable Interest Rates Source:https://tradingeconomics.com/united-states/interest-rate
Table 4: General Macro Data for the USA
2024 | 2025 | |
Annual GDP[3] | 29.184.900M | 30507.22 Expected (Statista) |
GDP per Capita[4] | 85.11 thousand$ | |
%2.8 | -% 0.5 (1.8) (Q1) 1.7% (Forecast 2026) [7] | |
Wages (NMW)[8] | 1.257$ | |
Min. Wage (June 2025)[9] | Alaska: 13$ California: 17.46$ to 22.50$ Oregon: 16.30$ | |
Inflation rate (CPI) (April 2025) [10] | 2.9% | |
Personal (Household)savings rate[11] | 5.1% April | % 4.5 (May 2025) |
Disposable income[12] | 17.494 billion USD (April 2024) | 17.929 billion $ (April 2025) |
Disposable personal income changes from the preceding month[13] | May 2025 – 0.7% April 2025 + 0.6% March 2025 + 0.6% | |
Ultra-High net worth Individuals (UHNWI)[14] | 7.9 million | |
Interest Rates [15] | %5 | 4.5% June 2025 |
Debts ($M)[16] | 35.251.180 | |
Consumer confidence index[17] | 52.2 (June 2025) | |
Global Innovation index[18] | 63.5 (out of 100) | |
CPI Consumer Price index[19] | 308.417 | 321.465 (May 2025) |
As we have discussed in our previous blogpost in China, China is dealing with a slowdown in its market right now, with a property market crisis, High Debts of GDP, low consumer confidence, and an additional tariff crisis with the USA. The forecast for the market is not so positive for 2025. The high household saving rates may accelerate luxury consumption. New wealth centers like Shenzhen and Wuhan may attract new brands. Slower domestic consumption is also expected because of the rebound in international travel and the decreasing rate of UNHWIs. (The State of Fashion, 2025, p.11)
For the US Market, the retail sales had the biggest drop in May by 0.9 although in terms of the fashion industry, clothing sales rose by 0.8 percent, and after the declaration of tariffs (Mutikani, Reuters, 2025; Kennedy, BOF, 2025). According to Apparel Resources, the US Clothing and accessory store retail sales increased by 0.67% in May 2025, and year-over-year sales increased 3.21% for the category. This increase in April was higher, with 5.14% (Apparel Resources, 2025). However, the tariffs will also impact on the imports for the fashion goods especially the European Brands The seasonally adjusted real imports of Apparel, Footwear and Household good index felt anyhow from 130 in 1/1/2022 to 85 in 1/1/2025, the decline indicates limited frontloading for apparel, footwear, and household goods compared to cars and pharmaceutical imports (Miller, Jin Ortega).
The announcement of tariffs had an impact on big ticket items like cars but right now there is no big impact on consumer spending in the USA with moderate job growth last month (144.000 new jobs in June dipped the unemployment rate by 4%[20]), the stabilization of interest rates by 4.5% to try to support the consumer spending. This helped the small increase for the USD index. Right now, the USD dollar index is increasing now 97.041

Figure 6: USD dollar index
However, according to Pearce economist at Oxford Economics, the effect of the tariffs may be more visible on real disposable incomes (Mutikani, Reuters, 2025). Consumers are still uncertain about the economic environment, student loan repayments, and the volatile stock market will force consumers to save for precautionary savings (Mutikani, Reuters, 2025).
IMF also revised its forecast for trade growth by 1.5%. The trade will continue, but it will be less efficient and costly. Uncertainty will grow on where to invest and where to source products and the components (Shalal, April 2025). The tariffs will also have an impact on Canada and Mexico IMF also revised both GDP Growth rates for Canada from 2% for 2025 and 2026 to 1.4 in 2025 and 1,6% in 2026 (Shalal, April 2025). For Mexico, the impact will be negative, -0.3% in 2025 and 1.4% in 2026 (Shalal, April 2025).
The Impact of the US Tariffs on Global Trade
The impact of the US tariffs will also be very important for the global supply chain in the future. Right now, three countries, Canada, China, and Mexico, have different tariffs ranging from 10% to 25% (Trade Compliance, July 2025).
There is also a positive position for some countries, like Japan the manufacturing readout showed a growth (Jibun Bank PMI rose to 50.1) for more than 13 months, and also South Korea and China manufacturing shows slight activation according to the China Manufacturing Caixin PMI Index (rose 50.4). India is the winner with the manufacturing activity reaching 3 3-month peak, riven by a substantial rise in international sales that also increased in hiring (Mutikani, Cable, Kihara, July 2025).
In USISM reported its manufacturing PMI index as 49.0 (in May it was 48.5). The shortening of the long delivery times helped with the increase. But factory employment dropped, and input prices became higher.
In Europe, from the manufacturing point of view, the star performers are Ireland, Spain, and still threatening the world order. The UK is trying to turn the corner, whereas the sweeping tariffs are (still threatening the world trade order Also, this uncertainty makes inflation volatile, especially for Europe (Mutikani, Cable, Kihara, July 2025).
Especially in the US, the housing market, consumer spending, and unemployment showed a slowed momentum for the US economy, and the trade deficit, because of the falling imports, will hurt GDP growth. Negotiators from major US trading partners would like to prevent the increase in import tariffs to higher levels. So far, South Korea and Japan have failed to win concessions, especially for automobile exports. In Europe, the HCOM Manufacturing Purchasing Manager Index is still below 50 (49.5 in June).In Germany, its highest in three years, but the Situation for France, Austria, and Italy looks negative (Mutikani, Cable, Kihara, July 2025).
Increasing the tariffs will have a significant impact not only on importing countries but on the global supply chain. Like reducing transactions, consumer inflation in the country imposing the tariffs, local economic activity in export-intensive manufacturing regions, and the importing country's labor dynamics. Like vegetables and fruits in the US, 59% of the fresh fruits and 35% of the vegetables consumed in the US are imported (Miller, Jin, Ortega, 2025, p.1).
In other areas, like the US steel industry, the import tariffs will have a different effect. In 2025, foreign industry, US Soybean farmers exporting to China, will see the Chinese reciprocal tariffs from China as a negative demand shock by raising the cost of imports (Miller, Jin, Ortega, 2025, p.2).:
These tariffs will generate supply and demand shocks, different responses from companies, and different forms of costs. Miller et al. summarized these costs in their final article in the Journal of Supply Chain Management as follows (Miller, Jin, Ortega, 2025, pp. 2-3).:
- Adjustment cost (Modifying Operations)
- Transaction cost
- Opportunity cost for responding early and
- Opportunity cost of responding late
Table 5: Different costs resulting from tariff changes:
Adjustment cost (Modifying operations) | Expanding labor |
Undertaking capital investments | |
Expanding domestic output (GM shifting production from Mexico to the US) | |
Moving production to lower-tariffed nations (Apple shifted the US iPhone production to India) | |
Tariff engineering: Changing the product features so the imported goods are subject to lower tariffs (Colombia Sportswear designs women's sportswear with a pocket below the waist) | |
Experimenting with different versions of domestic products | |
Relocating tooling and equipment between factories (A US Textile producer could not move its equipment from Mexico to the US because the inefficiency of the process required 2 years and 1000 truckloads). | |
Transaction cost (persuading, negotiating, coordinating, and teaching supply chain members) | Finding new suppliers |
Negotiating how tariff costs will be split | |
Finding new wholesalers to facilitate import or export from different countries | |
Teaching new suppliers to produce goods whose sourcing location has shifted. | |
Opportunity cost for responding early and | Paying higher unit prices because volumes are split across multiple factories in different countries. |
Quality problems: the new suppliers are at the beginning of the process. | |
Losing economies with consolidation and containerized goods before export. | |
Opportunity cost of responding late | Paying higher tariff rates. |
Reduced access to supplier capacity in lower tariff countries if the competitors have already obtained their capacity. | |
Disrupted operations if intermediate inputs cannot be obtained. | |
For seasonal items, esp. in the fashion business, missing the ordering time window. | |
Source: Miller J.W., Jin Y.H., Ortega D.L.: ``Shock and Awe: A Theoretical Framework and Data Sources for Studying the Impact of 2025 Tariffs on Global Supply Chains``, https://onlinelibrary.wiley.com/doi/10.1111/jscm.12350, Journal of Supply Chain Management, pp 2-3.
These costs and problems forced the companies to reconsider their responses to the demand and supply shocks; however, sometimes the solutions may cause further problems, as in the case of rare earth materials import from China for US Car Producers.
Miller et al. summarized these responses as follows for the exporters and the importers in a capitalistic economic system. However, these responses may change for government-owned enterprises. (Miller, Jin, Ortega, 2025, pp. 3-4):
For Importers:
· Negotiating with overseas suppliers, splitting the cost of tariffs
· Raising prices for the customers
· Frontloading the imports
· Using bonded warehouses or foreign trade zones
· Shifting sourcing for the US Market from more tariffed (like China) to less tariffed Nations (like India).
· Reducing the variety of imported best sellers
· Shifting production to domestic sources.
For Exporters:
*Lowering the process to offset some of the tariff increase
*Engaging in their tariff engineering by modifying products so that lower tariffs are charged for the importers
*Shifting their locations to lower-tariff nations to serve the US Market.
* Finding new and alternative destinations for export or
* Engaging in illegal activity such as falsifying the country of origin or engaging in illicit transshipment.
Another problem here is also comparing and balancing the cost, like lost sales, stopping the production, or responding too late, which is faced by the US Car makers in terms of rare earth materials (REE)[21] imported from China.
Table 6: Comparing and balancing the costs
Adjustment costs | Opportunity Cost for responding early | Opportunity Costs for Responding Late | |
Shifting some component assembly to China (despite tariffs) | Reducing features like -Adjustable seats or premium speakers that require magnets made from these rare-earth materials. | Plant shutdown due to the shortages | |
Result: | |||
Incurring tariffs | Lost sales because of the lack of features | Halting production because of the shortage of rare earth materials. | |
Source: Miller J.W., Jin Y.H., Ortega D.L.: ``Shock and Awe: A Theoretical Framework and Data Sources for Studying the Impact of 2025 Tariffs on Global Supply Chains``, https://onlinelibrary.wiley.com/doi/10.1111/jscm.12350, Journal of Supply Chain Management, pp 3-4
The impact of these costs depends on three factors, according to Miller et al. (Miller, Jin, Ortega, 2025, p.4).:
Table 7: Three factors that will influence the costs
Firm Factors | Response | Response |
Firm Size (Sales, larger size means more resources) | Reduces Transaction costs | Having the power to negotiate lower prices. |
Having the possibility to offset tariffs because of superior margins and financial resources to lower prices | ||
They can spread tariff-driven hikes across all product categories, even those that were not affected by the tariff hikes. | ||
Firms' existing supply chain structure and production network (own facilities or their suppliers). | Reduces Transaction costs | Having an expansive production network enables shifting the production more easily |
Relations between the suppliers, like cost sharing | ||
Product Factors: | ||
Security, Scale Economies | High adjustment costs | Siemens is producing the latest healthcare scanners only in Germany (scale economies). |
Having Testing and Certification facilities (Producing the children's car seats and strollers only in China because of the needed certification). | ||
Ease of Design change: | Complex interdependencies due to the nature of the system coupling (Changing materials in a jet engine vs. Changing the design of a cloth). | |
Tariff Uncertainty[22]: | Increases in Transaction Costs | |
Timing of tariffs | Increases the Opportunity cost for responding late | How long will it be in place |
Severity of tariffs | Increases Opportunity cost for responding early | Ad valorem rate (145% in April for China, %30 in May). |
Increases the degree of haggling. | ||
Taking more reversible actions: Scale back the hiring (%61.8 of US Managers) or capital investments (%58.8%) like US furniture manufacturers not planning to expand their operation (Miller et all 2025, p. 5. | ||
Source: Miller J.W., Jin Y.H., Ortega D.L.: ``Shock and Awe: A Theoretical Framework and Data Sources for Studying the Impact of 2025 Tariffs on Global Supply Chains``, https://onlinelibrary.wiley.com/doi/10.1111/jscm.12350, Journal of Supply Chain Management, p.4.
To see how US tariffs on steel, aluminum, and derivative products may affect the domestic prices, Miller et al. compared the PPI (Producer Price Index[23]) in the US vs. EU (Miller, Jin, Ortega, 2025, p.4-7).

Figure 7: Producer Price Index (PPI) in the EU

Figure 8: PPI for different items in the US
Another Index that can help estimate the import export price changes is called the BLS (Bureau of Labor Statistics export/import price index, which provides estimates of the import prices paid for various goods, excluding insurance, tariffs, etc. The Import price index[24] gives the situation from the importers’ point of view:

Figure 9: US Import Price Index
Source: https://www.bls.gov/opub/ted/2025/u-s-import-prices-up-0-2-percent-from-may-2024-to-may-2025.htm
According to the Bureau of Statistics report of 17 June 2025, U.S. import prices were unchanged in May; in April, it was a 0.1-percent increase. Higher prices for nonfuel imports offset lower prices for fuel imports in May. Prices for U.S. exports declined 0.9 percent in May, after accelerating 0.1 percent the previous month (Bureau of Labour Statistics, June 2025).
If the IPI is increasing, this dynamic is interpreted by Miller et al as price increases by US Producers and sharp drops in IPI (import price index) indicate exporters absorbing the tariffs[25][26].
Table 8: US Import Price Index

Regarding the data from the Bureau of Economics, in some industries it will be useful and cost-effective to frontload the imports like finished vehicles or pharmaceuticals, where there is a higher adjustment cost for shifting production than in retail or household goods. Therefore, fashion can adjust for the tariffs more easily to look for alternative production facilities (Miller et all. pp. 7-8).
Another possibility could be using a transshipment country to change the country of origin to bypass the high tariff rates, like goods imported from China. Here, a transshipment country like Indonesia could be used, but this will be misconduct and will have a distorting effect on the whole supply chain system (Miller et all. pp. 7-8). Further data about detailed analyses could be analyzed by using the US Longitudinal Foreign Trade Database (LFTTD)[27].
Here, the effects of the tariffs could be analyzed by the complexity of the supply chain system, which will be the key center of the researchers (Miller et al., P. 9):
· Horizontal Complexity: Number of Tier 1 Suppliers.
· Spatial complexity: Number of countries the goods are sourced.
· Supplier Differentiation (The variety of goods sourced.)
· Supplier instability in terms of firms changing their suppliers.
Effects of the tariff uncertainty on the global supply chain (EU-US)
Miller et all 2025 also mentioned in the conclusion of their research that US 2025 tariffs and the uncertainty will have a tremendous effect on global supply chain and global trade, which favors globalization like many supply chain management researchers (Miller et al., 2025, 9).
Right now, the situation with the EU is also uncertain, where the US would like to have at least 30% additional tariffs on all European goods. The tariff could also be higher if there is a counter tariff from the EU side (Mayer, July 2025). The tariff at such a high percentage will have a negative effect on the EU Growth rate, especially on Germany (another minus 0.5 crash of GDP). The deadline for the tariff negotiation between the EU and the US was the 9th of July. So far, there has been no conclusion, and the first has been postponed by 1. August. Countries like France, Spain, the Netherlands, Sweden, also would like to offer counter-tariff packages for US goods in the EU since April. The first tariff, which is not in due so far, has a volume of 2 billion Euros. The second will be 72 billion Euros for all trade areas. The EU would like to stand hard and also in case as a third step, demand new regulations from the US Tech giants and new taxes and costs(Mayer, July 2025).
These initiatives relieved especially Germany, which was under the biggest pressure because of the automobile industry, and Austria because of the Automobile suppliers in this country. The EU Meeting end of July offered a Principal Agreement with Trump tariffs at the lowest level of 10 percent. Some surcharges could be discussed in specific sectors in the long run, where the EU could buy from US more Oil and gas from the US. But still, for the EU, searching for other markets like Miller et al. suggested in their article is still an option. Here, MERCOSUR with South American Countries could replace 3/4 of US Exports from EU countries. Also, creating another alternative WTO without the US is another possibility to give a chance for other countries to join Global trade. Still, the EU would like to hopes to have a Tariff agreement with the US. Otherwise, 30 percent would have a tremendous effect on bilateral trade relations (Mayer, July 2025)..
European Central Bank published its Eurosystem staff macroeconomic projections in June, where we can see the effects of US tariffs on the EU Market, and also for the US and China under three different strategy projections, like baseline, mild, and severe. The report also compared the effect of tariffs on current export/import rates to and from the US.
The strategies that have been discussed in the article by Miller et al., A front-loading effect in anticipation of higher tariffs can also be seen in the Euro area from the table of the European Central Bank. But this high effect will be dampened by the 10% US tariffs on goods imports from the EU. Also, increased uncertainty will have a negative effect on exports, investment in capital goods in foreign countries domestic investment, especially in the Euro Area (ECB, 2025)

Figure 10: Euro Area goods export volumes
Source: https://www.ecb.europa.eu/press/projections/html/ecb.projections202506_eurosystemstaff~16a68fbaf4.en.html, Chart B.
The good news for the Euro Area right now is the relatively slower labor cost growth because of the downward path of wage growth and increased productivity growth. Rising real disposable income, an increase in both wage a non-wage income (like self-employment), will change consumer behavior, like a gradual decline in saving behavior and delayed recovery in household spending could be turn in to consumer spending will be normalize slowly if the consumer confidence recovers and the favorability of the labour market continues as positive like now. (ECB, 2025)

Figure 11: EU Household consumption, income, and savings
Source: https://www.ecb.europa.eu/press/projections/html/ecb.projections202506_eurosystemstaff~16a68fbaf4.en.html, Chart 3.
Right now, the European Central Bank assumes the external price pressures will be moderate if the tariff policies remain unchanged. The only problem is now the stronger euro, but the decline in energy prices for Europe will be good for the downward trend of inflation in Europe. However, the risks relating to US Tariff policies and high uncertainty forced the European Central Bank to prepare alternative scenarios for mild and severe situations.
The European Central Bank prepared two scenarios for mild and severe actions:
The baseline scenario assumes that US tariffs on goods imports are higher than in March projections. US Tariffs for goods imports would increase by 10% for all countries except for China, with an increase of 20% an effective tariff rate of 40%. It is also assumed the EU does not retaliate, while China retaliates symmetrically (ECB July Report 2025, Box 2, Chart A).
In the mild version in the third quarter of 2025, the EU and US will reach a deal on eliminating bilateral tariffs, and the US will reduce its tariffs on China, and China will remove all its retaliatory tariffs against the US. Other bilateral tariffs between the US and the rest of the world remained unchanged 13%. In this case, the trade policy uncertainty will decrease, and world trade will benefit from this (ECB July Report 2025, Box 2).
The severe scenario is the opposite of this. U.S. tariffs would return to the high levels announced on 2 April. For China, this level could be up 120%. Overall, this would be an effective US tariff of 28% on goods and services. This projection and its result create a more difficult situation for both countries, whereas China will search here other export markets like the Euro Area. The impact on global trade will be dampened and increase inflation pressures in the US (ECB, July 2025).

Figure 12: Effective Tariff Rates
Source: Eurosystem staff macroeconomic projections https://www.ecb.europa.eu/press/projections/html/ecb.projections202506_eurosystemstaff~16a68fbaf4.en.html
If the US tariffs are increased and trading partners retaliate, this can slow down the global trade, demand in Euro are and also increase inflation (now %2 for EU Area and 1.6% for 2026), also a possible recession in the United States would have a negative spillovers effect to growth in other economies, for EU a severe scenario of 0.5 % growth for 2025, 0.7% in 2026 like 1.1 (2027) and a - 0.7% to -0.8 decline in cumulative 2025-2027 relative to the baseline. A successful agreement between EU and US could also reduce inflationary pressures in the United States (and help the growth in the EU Area (1.2% for 2026 and 1.5% in 2027) (ECB, July 2025).
Table 9: June 2025 GDP Estimations for EU
| June 2025 Estimations for EU | |||
Real GDP | 2024 | 2025 | 2026 | 2027 |
June 2025 Baseline (US Tariffs 10% for EU) | 0.8 | 0.9 | 1.1 | 1.3 |
Alternative Scenorio (mild) | 0.8 | 1.2 (+0.3) | 1.5 (+0.4) | 1.4 (+0.1) |
Alternative Scenario (Severe) | 0.8 | 0.5 (-0.4) | 0.7 (-0.4) | 1.1 (-0.2) |
Source: https://www.ecb.europa.eu/press/projections/html/ecb.projections202506_eurosystemstaff~16a68fbaf4.en.html , Page 1.
Table 10: June 2025 Inflation Estimations for EU
| June 2025 Estimations for EU | |||
HICP (Harmonized Index of Consumer Prices) | 2024 | 2025 | 2026 | 2027 |
June 2025 Baseline (US Tariffs 10% for EU) | 2.4 | 2.0 | 1.6 | 2.0 |
Alternative Scenario (mild) | 2.4 | 2.0 | 1.7 (+0.1) | 2.1 (+0.1) |
Alternative Scenario (Severe) | 2.4 | 2.0 | 1.5 (-0.1) | 1.8 (-0.2) |
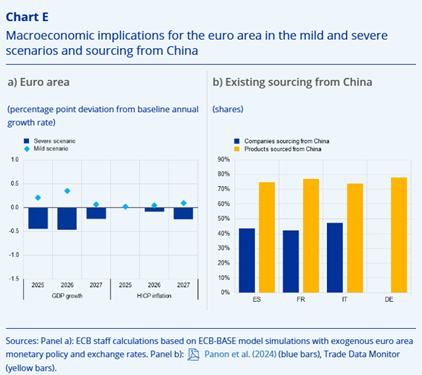
Figure 13: Implications for the Euro Area in the mild and severe scenarios
Source: https://www.ecb.europa.eu/press/projections/html/ecb.projections202506_eurosystemstaff~16a68fbaf4.en.html, Box 2, Chart E.
So far in Q1 2025, EU area economic activities have increased by 0.3% in Q1 2025 because of the strong frontloading export. Domestic demand and private consumption increased due to the improving real income. Industrial activities also increased because of the frontloading of purchases in anticipation of tariffs. However, in the future, if the severe scenario is realized, the EU redirection of Chinese Exports from the US to the EU will cause a rapid expansion of the Chinese Distribution network. This expansion will also influence the pricing; hence, the Chinese government supports the exporters and compresses the profit margins. If the EU regulations for anti-dumping measures are delayed during the implementation process, that will amplify the downward pressure on inflation in the euro area for the severe scenario (ECB, 2025).
For the US, the severe scenario would be no increase in US exports to other countries, but there will be a slight increase in imports from other countries. Higher prices will cause an inflation of up to 0.05 points, and the severe scenario forecast minus 0.5-0.7 points GDP decline in two years and a negative deviation from the baseline[28]
In the mild scenario, the lower tariffs and lower trade policy uncertainty will have a small impact on growth and inflation in the US and China. For US 0.2-0.3 GDP Growth in 2025-2026 (ECB July 2025, Box 2).
Table 11: Table 9: June 2025 GDP Estimations for US
GDP Percentage points deviation from the Baseline | 2025 | 2026 | 2027 |
Alternative Scenario (mild) deviation from the Baseline | +0.1% | +0.2% | 0.01% |
Alternative Scenario (Severe) deviation from the Baseline | -0.4% | -0.07% | 0.01% |

Figure 14: Implications for the US and China in the mild and severe scenarios
Source: European Central Bank: https://www.ecb.europa.eu/press/projections/html/ecb.projections202506_eurosystemstaff~16a68fbaf4.en.html
China`s GDP will be 0.6 % lower in 2025 and 0.3% lower in 2026, which will make the inflation expectations lower than US. The two assumptions of the two scenarios can be seen in the ECB report (ECB, July 2025).
All these developments will also have a huge effect on the fashion world. Where the US is the biggest market for many European Fashion Brands, especially from France, Spain, and Italy, in terms of both luxury and non-luxury markets. The solutions like sourcing from other countries, transferring their production partly to the US, or looking for different new markets will be the biggest discussion for Fashion brands.
In general, the focus of all the brands will be on differentiation in different terms like in terms of new designs or customer experiences, or new customer niches. The biggest challenge will be the new market entry models and logistics issues like localization or leveraging through value propositions like pricing, fulfillment channels, or different assortment for local needs. These will be more important for emerging markets like India.
Having a larger assortment of different price points, like the Armani branding strategy, will help many companies attract more customers in different price segments and control the inventory levels more strictly.

Figure 15: Armani brand architecture
Fashion executives also prioritize the cost of AI and digital innovation over cost reduction. This year, the expectation for the general cost growth will be single-digit rates this year. An unfortunate improvement among the managers is that the sustainability issue remains a little bit in the background, where the focus will be on differentiation and offering new designs to the market. (The State of Fashion, 2025, p. 13).
However, there will always be brands that could act agilely and sustainably in different sectors. In our next blog articles, I will focus more on brand creation strategies of these brands and try to analyze their strategies.
Azra Bayraktar
July 2025
References:
Apparel Resources: 17 June 2025, `` May sees uptick in US clothing sales, defying drop in tariff-driven stockpiling``, retrieved on 3 July 2025 from https://apparelresources.com/business-news/retail/may-sees-uptick-us-clothing-sales-defying-drop-tariff-driven-stockpiling/#:~:text=US%20clothing%20and%20accessory%20store,face%20of%20increasing%20economic%20uncertainty.
Bureau of Labour Statistics: 17 June 2025, retrieved from https://www.bls.gov/news.release/ximpim.nr0.htm
Country Economy: https://countryeconomy.com/countries/compare/china/usa?sc=XE0H
Davidson A.: June 2009, ``Armani, King of Italian Fashion``, retrived from https://www.ashleyedavidson.com/blog/armani-king-of-italian-fashion
ECB (European Central Bank), July 2025: retrieved on July 16, 205, from https://www.ecb.europa.eu/press/projections/html/ecb.projections202506_eurosystemstaff~16a68fbaf4.en.html.>
Kainrath, V.: ``Mehr erleben weniger kaufen``, retrieved 14 May 2025 from < https://www.derstandard.at/story/3000000269576/mehr-erleben-weniger-kaufen-oesterreichs-einzelhandel-kommt-nicht-vom-fleck>.
Kennedy, Joan: 12 June 2025, `` Surprise! Why Apparel Prices Are Actually Falling. Business of Fashion Retail, retrieved July 2025 from https://www.businessoffashion.com/articles/retail/surprise-why-apparel-prices-are-actually-falling/
Mayer, Thomas: 15 July 2025 ``EU schlaegt im Zollstreit haertere Tone an` Standart Wirtschaft``, p. 11, 15 July 2025, retrieved from https://www.derstandard.at/story/3000000279333/haertere-sprache-aber-eu-will-mit-usa-weiter-konstruktiv-verhandeln.
Miller J.W., Jin Y.H., Ortega D.L.: ``Shock and Awe: A Theoretical Framework and Data Sources for Studying the Impact of 2025 Tariffs on Global Supply Chains``, https://onlinelibrary.wiley.com/doi/10.1111/jscm.12350, Journal of Supply Chain Management, pp: 0:1-13
Mutikani, Lucia: 17 June 2025 `` US Retail Sales Post Biggest Drop in Four Months``, Reuters, https://www.businessoffashion.com/news/retail/us-retail-sales-post-biggest-drop-in-four-months/
Mutikani L/, Cable J., Kihara L. :1. July 2025: Tariff risks muddy global outlook for factories`` https://www.reuters.com/world/china/global-economy-asian-factories-hobbled-by-us-tariff-risks-despite-modest-relief-2025-07-01/
Shalal A.: April 22, 2025: ``IMF cuts growth forecasts for most countries in wake of century-high US tariffs’ ''Retrieved on July 3, 2025, from https://www.reuters.com/business/imf-cuts-growth-forecasts-most-countries-wake-century-high-us-tariffs-2025-04-22/#:~:text=The%20IMF%20downgraded%20its%20forecast,policy%20uncertainty%20and%20trade%20tensions.
Trade Compliance Hub: retrieved on July 3, 2025, from https://www.tradecomplianceresourcehub.com/2025/07/07/trump-2-0-tariff-tracker/,
The State of Fashion: Business of Fashion (BoF and Mc Kinsey) : https://www.businessoffashion.com/reports/news-analysis/the-state-of-fashion-2025-bof-mckinsey-report/, or <https://www.businessoffashion.com/user/document-viewer/?payload=eyJjdGFMaW5rIjoiaHR0cHM6Ly9jZC5idXNpbmVzc29mZmFzaGlvbi5jb20vcmVwb3J0cy9UaGVfU3RhdGVfb2ZfRmFzaGlvbl8yMDI1LnBkZiIsImFydGljbGVJZCI6Ikw1UURLVEVMNlZHVURNQ1RPUUdHSkxRUllZIiwiYXJ0aWNsZVVybCI6Ii9yZXBvcnRzL25ld3MtYW5hbHlzaXMvdGhlLXN0YXRlLW9mLWZhc2hpb24tMjAyNS1ib2YtbWNraW5zZXktcmVwb3J0LyIsInNpZ25lZCI6ZmFsc2UsInVzZXJJZCI6IjEyNjg2MjU4MTQ3NzQifQ=>
World Wealth Report 2025: https://www.capgemini.com/insights/research-library/world-wealth-report/?utm_source=PR&utm_medium=PR&utm_campaign=wwr&utm_cre=IMG&utm_id=2025May07
[14] https://www.capgemini.com/news/press-releases/north-america-high-net-worth-individual-population-surges-while-europe-and-middle-east-shrink/
[21] The rare-earth elements (REE), also called the rare-earth metals or rare earths, and sometimes the lanthanides or lanthanoids (although scandium and yttrium, which do not belong to this series, are usually included as rare earths),[1] are a set of 17 nearly indistinguishable lustrous silvery-white soft heavy metals. Compounds containing rare earths have diverse applications in electrical and electronic components, lasers, glass, magnetic materials, and industrial processes. The term "rare-earth" is a misnomer because they are not actually scarce, but historically, it took a long time to isolate these elements.[2][3] (https://en.wikipedia.org/wiki/Rare-earth_element).
[22] What tariffs will be imposed on which country, for how long (Miller et all 2025, p. 4)
[23] The industrial producer price index PPI measures the gross monthly change in the trading price of industrial products (there are also producer price indices for construction and for services).
The industrial producer price index (PPI) measures price changes from the point of view of the producers/manufacturers of a product (it is thus an output price). In this, it differs from consumer price indices, which measure the prices from the point of view of consumers/buyers (https://ec.europa.eu/eurostat/statistics-explained/index.php?title=Industrial_producer_price_index_overview)
[27] https://www.census.gov/programs-surveys/ces/data/restricted-use-data/longitudinal-firm-trade-transaction-database.html
[28] The baseline scenario assumes that US tariffs on goods imports are higher than in March projections. US Tariffs for goods imports would increase by 10% for all countries except for China, with an increase of 20% an effective tariff rate of 40%. It is also assumed the EU does not retaliate, while China retaliates symmetrically (ECB July Report 2025, Page 1, Chart A).


link link link link link link link link link link link link link link link link link link link link link link link link link link link link link link link link link link link link link link link link link link link link link link link link link link link link link link link link link link link link link link link link link link link link link link link link link link link link link link link link link link link link link link link link link link link link link link link link link link link link link link link link link link link link link link link link link link